
The app launch experience is the first impression you make on a user. Every millisecond they wait for your app to start is valuable time they could spend elsewhere. If your app has high engagement and is used multiple times a day then users have to wait for launch over and over. Apple recommends the first frame be drawn in under 400ms. This ensures your app is ready to be used when Springboard’s app open animation finishes.
With only 400ms to spare, developers need to be very careful not to accidentally increase app startup time. However, app launch is such a complicated process with so many moving parts that it’s difficult to know what exactly contributes to it. I started diving deeper into the relationship between app binary size and startup time while working on Emerge, the app size profiler. In this post, I’ll demystify one of the more esoteric aspects of app launch and show you how Swift reference types contribute to the binary size and slower app start times.
Dyld
Your app starts when the Mach-O executable is loaded by dyld. Dyld is Apple’s program responsible for getting an app ready to use. It runs in the same process as the code you write and starts by loading all dependent frameworks¹, including any system frameworks.
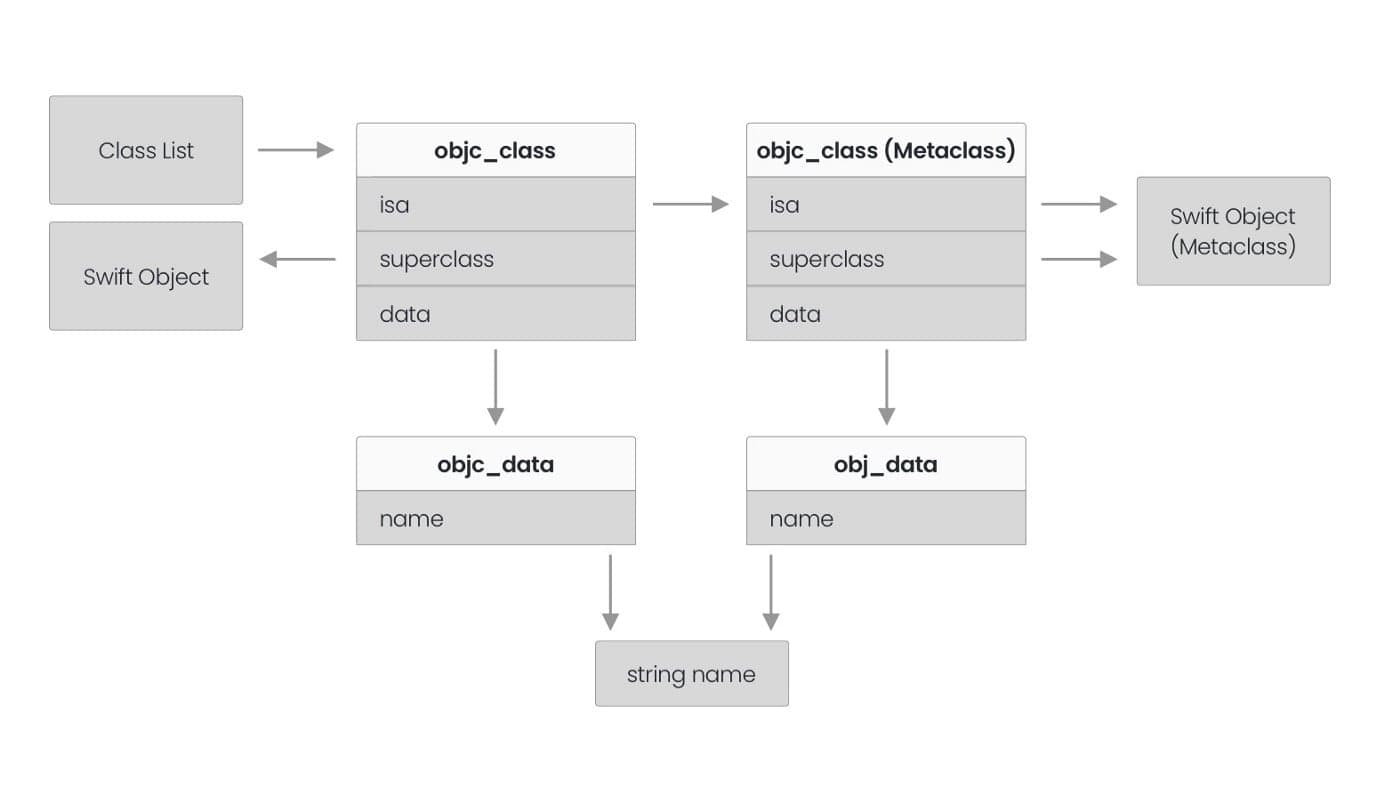
Part of dyld’s job is “rebasing” pointers in binary metadata that describe types in your source code. This metadata allows for dynamic runtime features, but can be a common source of binary size bloat. Here’s the layout of an Obj-C class found in a compiled app binary:
struct ObjcClass {
let isa: UInt64
let superclass: UInt64
let cache: UInt64
let mask: UInt32
let occupied: UInt32
let taggedData: UInt64
}
Each UInt64 is the address of another piece of metadata. This is in the app binary, so everyone in the world downloads the exact same data from the app store. However, each time your app is launched it’s placed in a different location in memory (as opposed to always starting at 0) due to address space layout randomization (ASLR). This is a security feature designed to make it hard to predict where a particular function is in memory.
The problem with ASLR is the address hardcoded into your app binary is now wrong, it’s offset by a random start location. Dyld is responsible for correcting this by rebasing all pointers to take into account the unique start location. This process is done for every pointer in your executable, and all dependent frameworks, including recursive dependencies. There are other kinds of metadata setup done by dyld which impact startup time, such as “binding”, but for this article, we’ll just focus on rebases.
All this pointer setup increases app startup time, so reducing it results in a smaller app binary and a faster start time. Let’s see where it comes from and exactly what the impact can be.
Swift and Obj-C
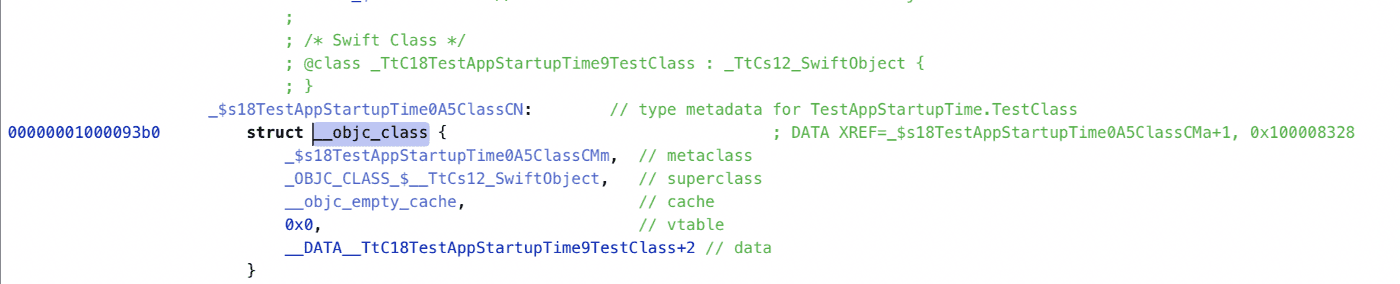
We saw that rebase time is caused by Obj-C metadata in your app, but what exactly causes this metadata in a Swift app? Swift has the @objc attribute to make declarations visible from Objective-C code, but metadata is generated even when your Swift type is not visible to Obj-C code. This is because all Swift class types contain Objective-C metadata on Apple platforms. Let’s see this in action with the following declaration:
final class TestClass { }This is pure Swift, it doesn’t inherit from NSObject and doesn’t use @objc However, it will produce an Obj-C class metadata entry in the binary and add 9 pointers that need rebasing! To prove this, inspect the binary with a tool like Hopper and see the objc_class entry for your “pure Swift” class:
You can view the exact amount of pointer rebasing needed to launch an app by setting the DYLD_PRINT_STATISTICS_DETAILS environment variable to 1. This will print the total number of rebase fixups to the console after the app launch. We can even map out exactly where these 9 pointers are found.
Not all Swift types add the same number of rebases. If you expose methods to Obj-C by overriding from a superclass or conforming to an Obj-C protocol you’ll add even more rebases. Plus every property on your Swift class will generate an ivar in Objective-C metadata.
Measuring
The actual launch time impact of rebasing will vary based on the device type and what else is running on the phone. I measured on one of the oldest devices still commonly supported, the iPhone 5S.
iOS launches can be roughly categorized into warm and cold. Warm is when the system has already launched the app and cached some dyld setup information. Since the first launch I tested was a cold start it was a bit slower than others².
In this case, we’re seeing ~1ms increase per 2000 rebase operations. This won’t be an absolute addition to startup time because some operations can be done in parallel, but it does give us a lower bound, and with 400k rebases we are already halfway to Apple’s recommended limit of 400ms.
Examples
Measuring the number of rebase operations in a few popular apps gives a sense of how common these are in practice.
% xcrun dyldinfo -rebase TikTok.app/TikTok | wc -l
2066598
TikTok has over 2 million rebases, this results in a whole second of startup time! TikTok uses Objective-C, but I also tested a few of the largest Swift apps that use a monolithic binary architecture (as opposed to frameworks) and found between 685k and 1.8m rebases.
What can be done?
Although each class increases rebase operations, I’m not recommending replacing every Swift class with a struct. Large structs can also increase the binary size and in some cases, you just need reference semantics. As with any performance improvement, you should avoid premature optimization and start with measurement. Emerge can determine how many rebases are in your app, which modules they come from, and what types in those modules are the biggest contributors. Once you’ve measured the problem you can look for areas of improvement in your own app. Here are a few common cases:
Composition vs Inheritance
Say you have a data layer like this:
This will generate a lot of metadata, but you can represent the same idea with value types which is preferred for a data layer, and end up with 22% fewer rebases. This involves replacing object inheritance with value composition, such as enums with associated values or generic types.
Categories in Swift
Even though Swift uses extensions and not categories, you can still generate category binary metadata by declaring an extension that uses an Objective-C function. Take the following example declaration:
Both functions are included in the binary metadata, but since they are declared in an extension they are referenced by a synthesized category on TestClass. Move these functions into the original class declaration to avoid the extra overhead of category metadata being included in the binary. This kind of metadata can be automatically flagged with Emerge’s binary analysis tools.
Going one step further, you can avoid @objc entirely by using closure-based callbacks such as the ones introduced in iOS 14.
Many properties
Properties in a Swift class each add 3 to 6 rebasing fixups, depending on if the class is final. These can really add up for large classes with 20+ properties. For example:
Converting it to be backed by a struct reduces the number of rebase fixups by 60%!
Codegen
One of the highest ROI changes you can make is improving codegen. A popular use of codegen is to create data models shared across codebases. If you’re doing this with many types you should be wary of the amount of Obj-C metadata they can add. However, even value types have an overhead in code size and rebase fixups. The best solution would be to minimize the amount of codegened types, even replacing custom types with generated functions.
These examples are just a few of the ways binary size can lead to increased startup time. Another contributor is the time to load code from disk into memory, the more code you have the longer this takes. If you want help finding ways to reduce the size and startup time of your app, you can get in touch with the Emerge team by sending a note to [email protected]!
[1] Framework is an overloaded term. Technically dyld will setup all the Mach-O image files your app requires to launch. Some of these won’t be frameworks, and some frameworks aren’t required at app launch.
[2] I also ran each test a few times and found repeat launches would have faster rebase times also due to the warm start. For simplicity, I just reported the first run of the test here since it provides a more stable number to benchmark against.