Milliseconds matter
Startup time is a crucial app metric that should be continuously monitored and improved. A/B tests at top mobile app companies consistently show that adding just fractions of a second can significantly hurt core usage metrics, such as daily active users and time spent on the app per user per day.
Lyft reported a 5% increase in user sessions thanks to a 21% decrease in startup time for their driver app. Apple has made startup time the subject of numerous WWDC presentations[1][2][3].
Instead of high level claims about avoiding common anti-patterns to improve startup time, this blog post will use Emerge's Performance Analysis product to diagnose specific app startup issues and find improvements. This post will focus on iOS apps, however Emerge's tooling has full parity across both Android and iOS.
These are real optimizations that apply to public App Store builds with no developer involvement.How we measured startup
Since the apps analyzed here are taken from the App Store without any debug information or source code, we
decided to simply define "startup time" as the earliest point of app launch until the end of
applicationDidBecomeActive(_:).
For mobile app teams working with Emerge, startup time definitions are fully customizable by the
developer. A common use case would be defining endpoints past applicationDidBecomeActive(_:) to measure the
time to when the user can meaningfully interact with the app.
This means that the startup time measurements shown below are likely conservative estimates compared to what a
developer at the company might consider startup to be.
Because of the lack of any debug symbols, we're unable to fully de-obfuscate many of the function names. Apps that are part of an Emerge CI integration with debug symbols included would result in a much more detailed flamegraph.
Emerge utilizes a state-of-the-art physical device farm to ensure that performance measurements are as accurate as possible. The following main thread measurements were conducted on an iPhone SE (2020) running iOS 15.4.1.
It's important to note that a single measure of an app's startup time is exactly that and shouldn't necessarily be extrapolated to represent a larger sample size. Controlling variance is akin to taming a wild beast; everything from the app being logged in, recently launched, the device type, or even the temperature of the device can all drastically affect results.
Now let's see how 5 popular apps could improve their startup time...

The United app has already been discussed at length by others due to app size issues, but its startup time also has a lot of room for improvement. Three things immediately jump out:
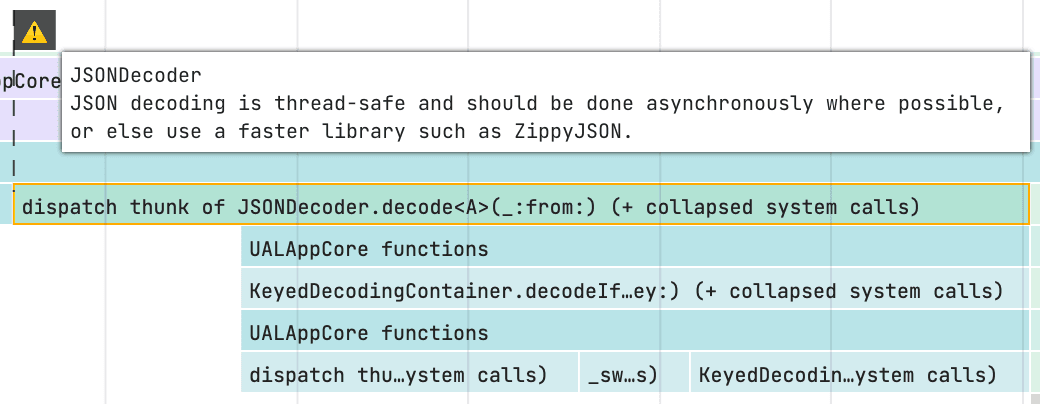
- Automated insight: United spends 48ms in
JSONDecoder.decode(), which should either be done in the background or sped up with a faster third-party JSON library like my own ZippyJSON. - United spends 677ms in
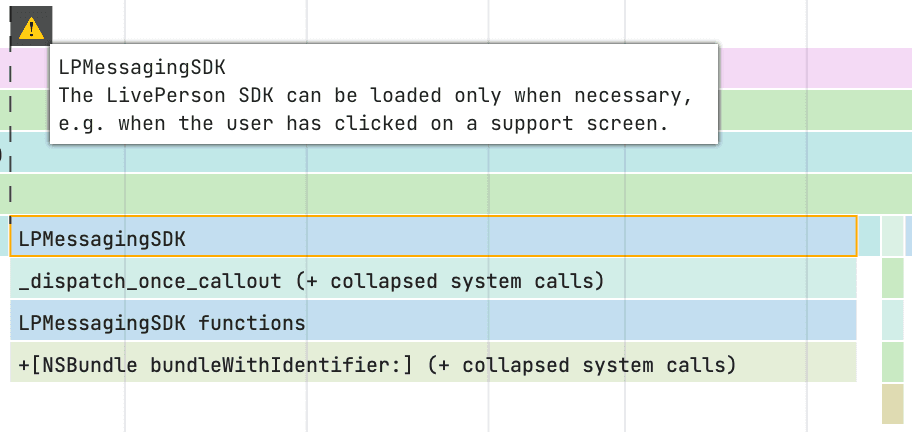
-[NSPersistentContainer loadPersistentStoresWithCompletionHandler:]. Core data work like this should be done off of the main thread. A delay this huge likely points to other anti-patterns being present. - United spends 103ms in LPMessagingSDK, which calls
Bundle.init(identifier:). This method takes an identifier and returns the bundle that matches that ID (CFBundleIdentifierin the Info.plist). Although the method might seem innocuous, it has to load all the bundles from disk until it finds the one with the right bundle ID. This includes both user-supplied bundles, such as frameworks, as well as all of Apple's many bundles. When the bundles are first loaded, they become cached to some extent. Rerunning the app again immediately after sees a startup time reduction of 20ms, but for cold-start, this load cost must be paid. The app should be changed to delay the LPMessagingSDK initialization until the feature is actually needed (which is likely only when the user goes to a support page).

- Automated insight: United's app isn't the only one to fall prey to issues with LPMessagingSDK. Chipotle's app spends
187ms of startup in LPMessagingSDK in
Bundle.init(identifier:), which, as discussed above, can be moved off the startup path.

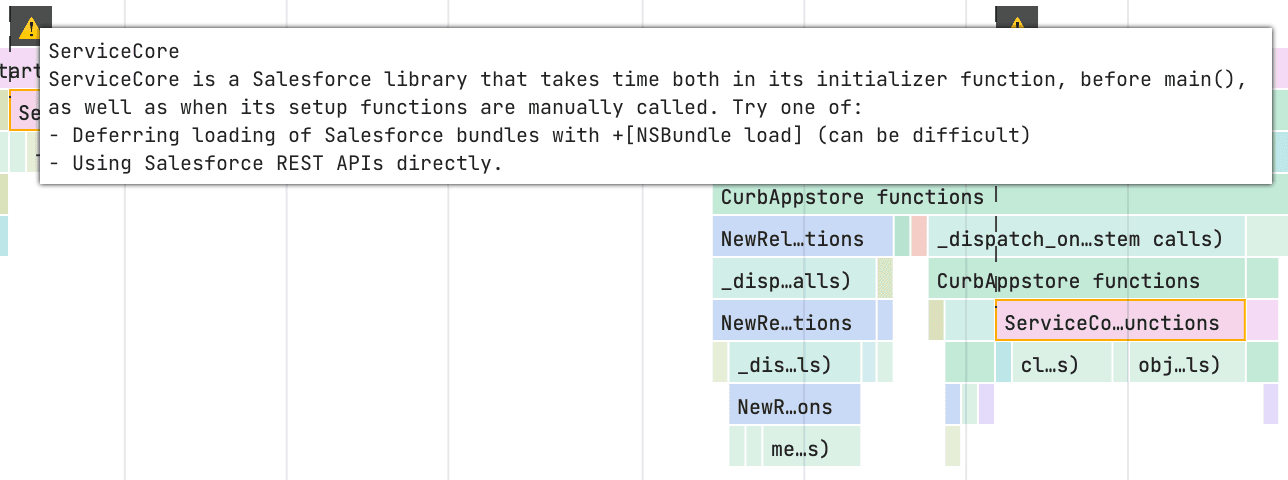
Curb is the only app we analyze here that uses the Salesforce Service Cloud SDK. This SDK provides APIs
and UIs for customer relationship management tools, such as support chat. As with LPMessagingSDK, the Salesforce Service Cloud SDK
does some very costly loading of bundles. Specifically, it spends 83ms in Bundle.allFrameworks, and then another 93ms in
NSArray.filtered(using:) immediately after. These method calls are at the very beginning of startup (or at least the
portion we can record), suggesting that they're initializers. Initializers are special functions that are implicitly
run during early startup, such as during NSObject.load() methods.
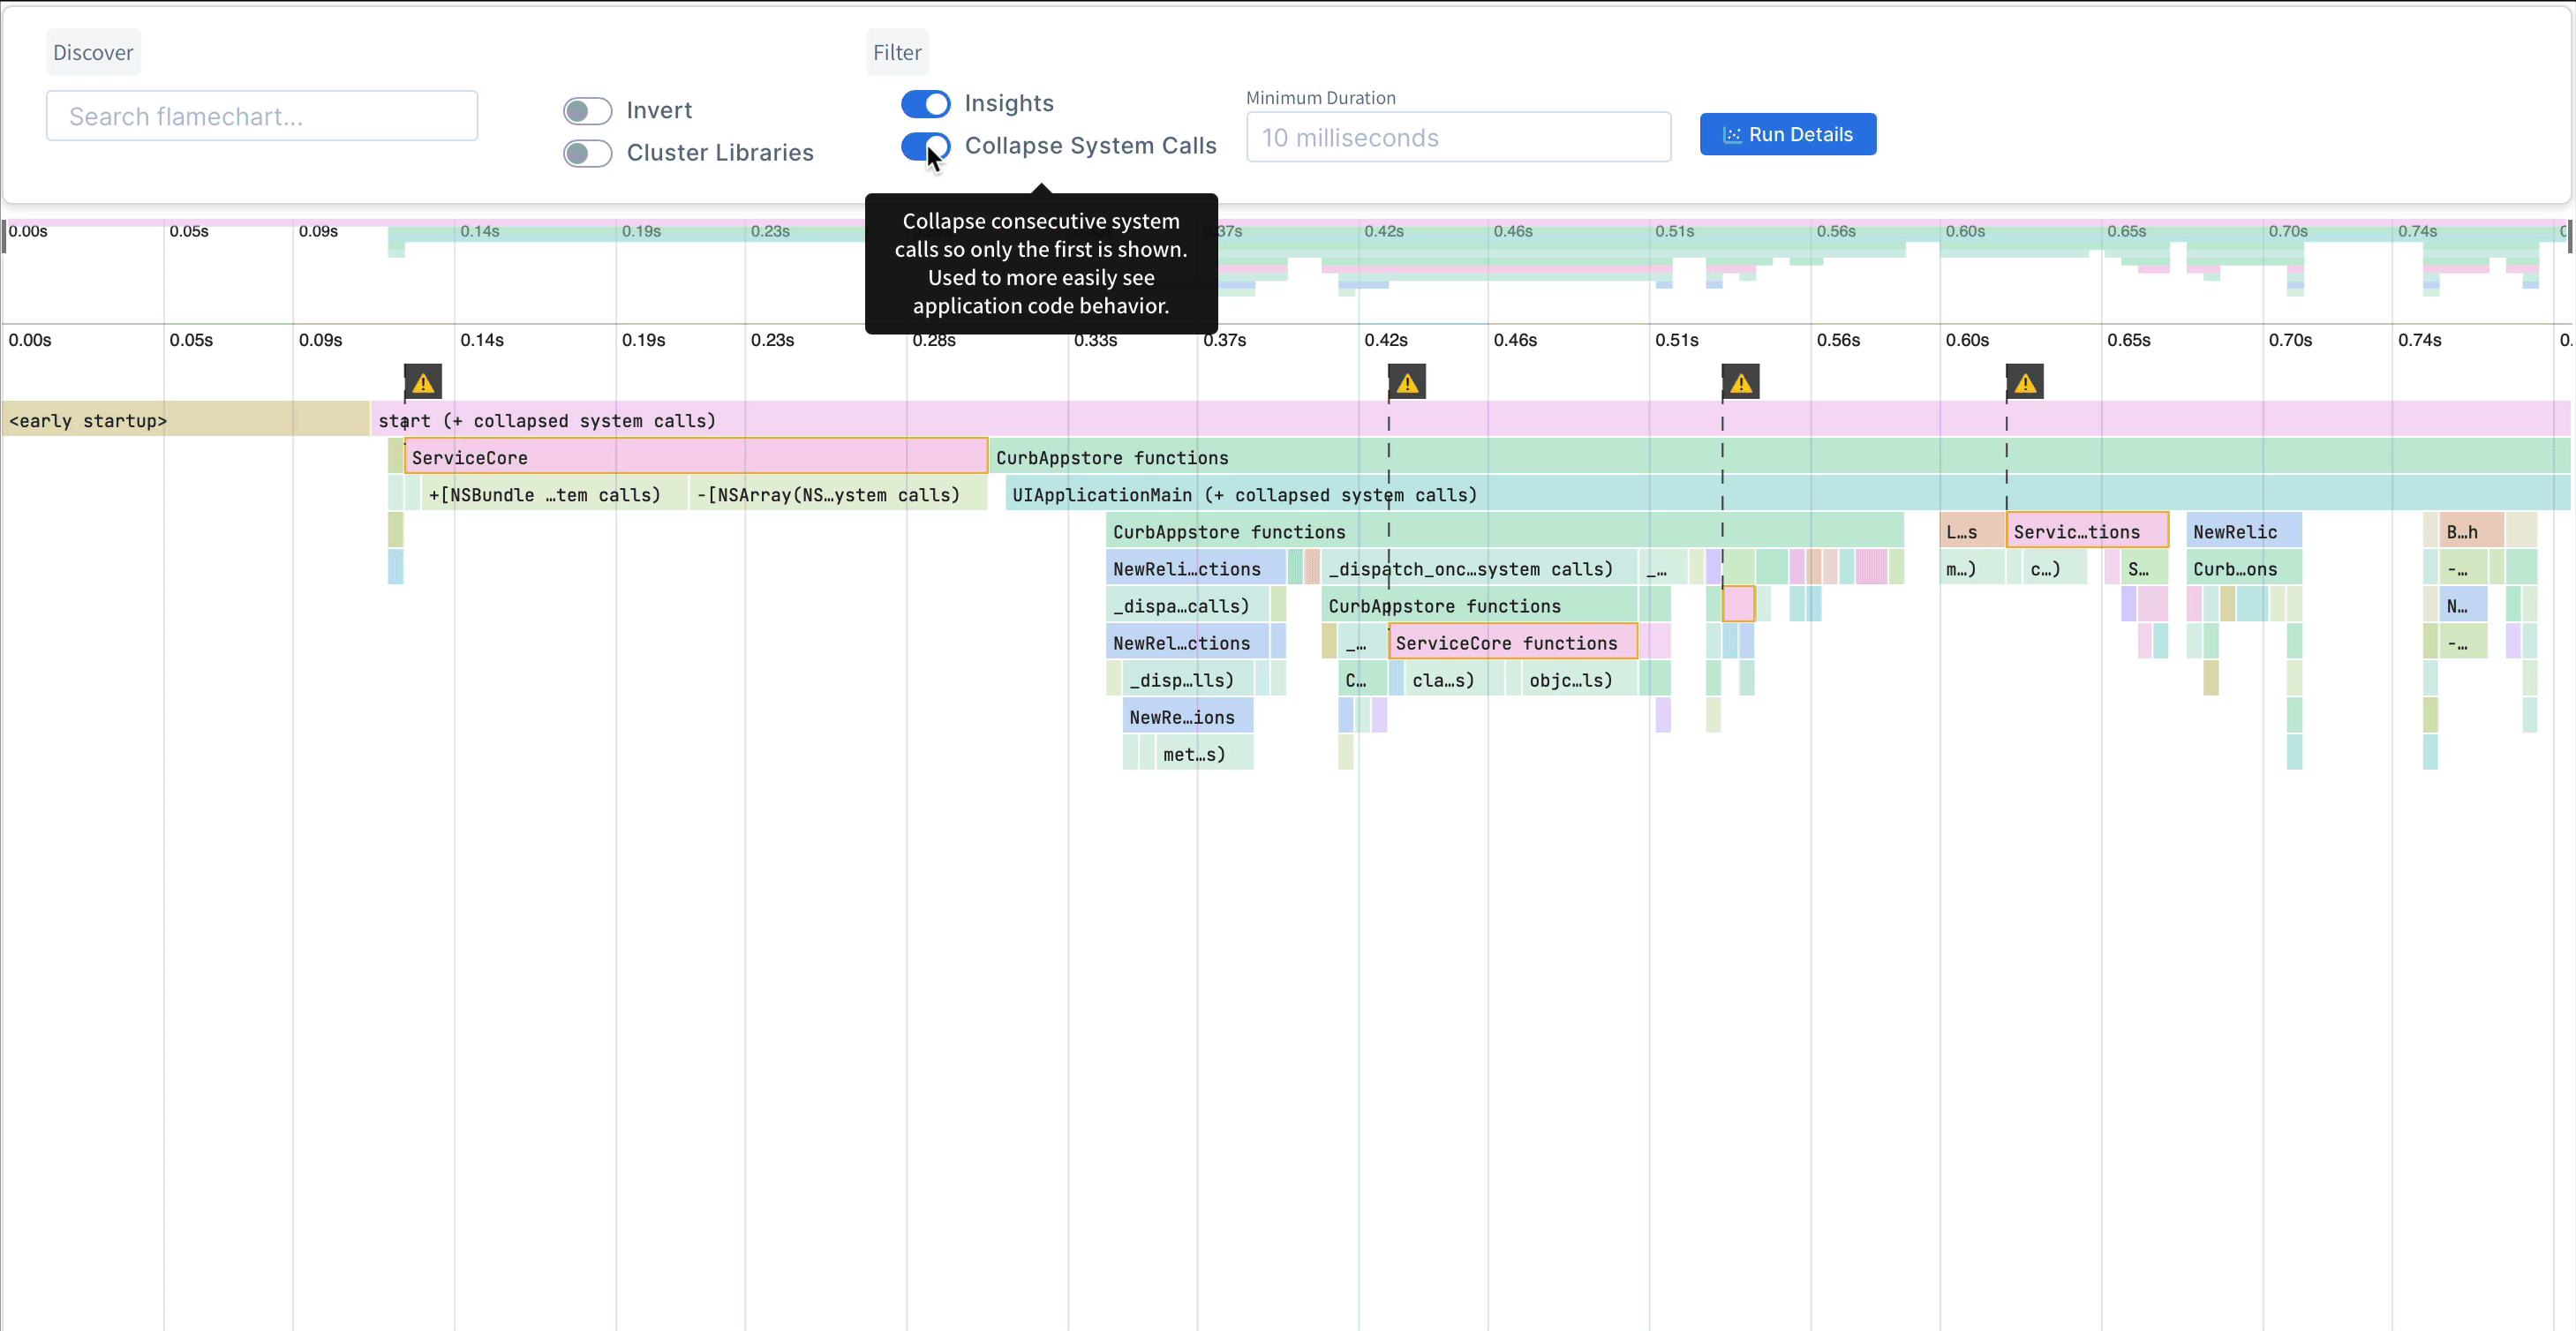
If we switch the "Collapse system calls"
toggle in the UI, we can see they're indeed initializers that aren't being run by app code, but instead by
dyld4::Loader::findAndRunAllInitializers. After decompiling that library with Hopper, we find that the subsequent
function is calling Bundle.allFrameworks and doing essentially the following:
var frameworksList: [Bundle]?
...
func initializeFrameworkBundles() {
...
let allFrameworks = NSBundle.allFrameworks
let predicate = Predicate(format:"bundleIdentifier BEGINSWITH %@", "com.salesforce")
frameworksList = allFrameworks.filteredArray(predicate:predicate)
...
}
NSBundle.allFrameworks is expensive because it does some initial setup and/or fetching from cache for every single
framework. This includes user-supplied frameworks as well as many Apple frameworks. The
NSArray.filteredArrayUsingPredicate(using:) call is expensive for a similar reason: it calls
NSBundle.bundleIdentifier for every single framework bundle. This means that on top of the initial setup done in
NSBundle.allFrameworks, it now has to read the Info.plist for each framework and get the CFBundleIdentifier value.
Although it can be faster on further runs due to caches being filled, it will still take a non-trivial amount of
time, and cold start remains an important case.
Salesforce could avoid all of this by reducing its search to just the
user-supplied frameworks in *bundle path*/Frameworks, or better yet searching for the frameworks by name that it
knows could be Salesforce provided. For an app developer who uses Salesforce, it's tougher to
work around. Unlike with LPMessagingSDK, where the developer could control when initialization occurs and move it completely off
the startup path, the developer doesn't have that option for an initializer function that gets run automatically by the system.
To SDK developers: please don't use initializer functions. They are much harder to measure the impact on startup and to prevent/delay from running. Not only can they hurt performance, but also stability as I think we all remember in the Facebook SDK fiasco.
With this in mind, here are some mitigation approaches:
- For the adventurous, try not linking the Service Cloud frameworks, instead include them in the app bundle and use
Bundle.load()to load them before calling the APIs (since oftentimes the SDK is only needed for very specific, less-commonly used screens, like customer support). - Use the Service Cloud REST API directly, rather than via their libraries.
- Use an alternate service entirely.
Beyond the issues mentioned above, the Salesforce Service Cloud SDK spends 67ms running class_conformsToProtocol
and objc_copyClassList (perhaps iterating over all classes to determine which ones conform to some protocol) in
non-initializer setup. All of this setup can likely be moved out of startup.
As for other SDKs, we see NewRelic taking 4% of startup due to method swizzling, LeanPlum taking 3% due to
method swizzling, and Realm taking 1% for objc_copyClassList (probably only 1% because Service Cloud SDK warmed up
the caches by calling that function first). Although Realm might be fairly integral to the startup
path, the other two SDKs seem like they can at least be delayed slightly to
allow the startup screen to display before blocking the main thread.

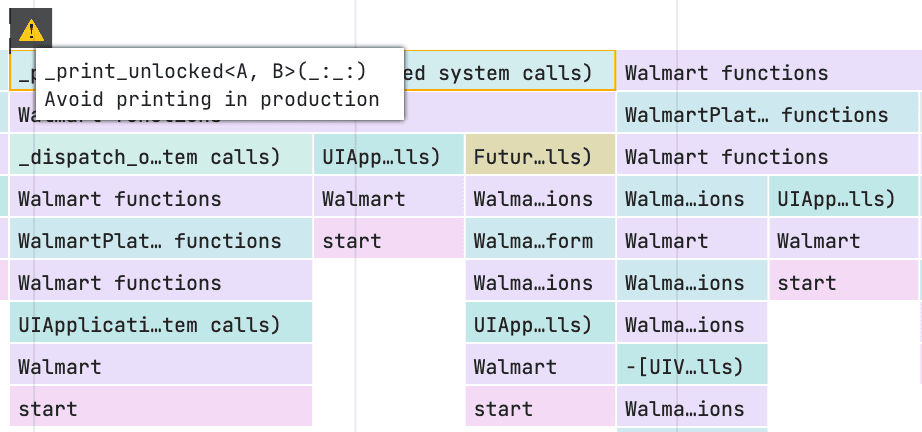
- Automated insight: Walmart spent 20ms on
printstatements, which should not be used in a production App Store app - Walmart also spent 197ms of startup on
String.init(describing:). Generally, this is a sign that an app is trying to either use that string as a unique ID (in which case it should useObjectIdentifierinstead), or that it may be calling this method as part of logging, which can just be removed.

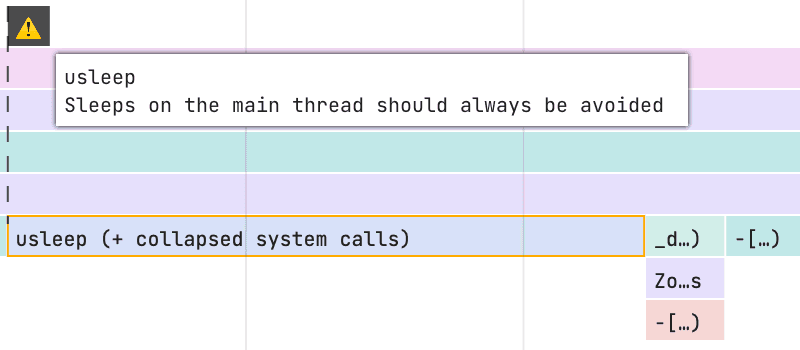
- And lastly, my personal favorite. Zoom's app actually spends 41ms sleeping on the main thread during startup.
Conclusion
Even at the largest scale, managing mobile app performance is extremely challenging. Startup time is one of the most common and accessible performance metrics, but achieving accurate measurement in the development process is a major hurdle.
Using Emerge’s Performance Analysis product, we were able to analyze and propose startup time improvements for five popular iOS apps downloaded directly from the App Store. Many of the insights proposed in this blog post are automated insights from Emerge’s Performance Analysis product which automatically identifies and suggests performance improvements.
Once integrated into CI, a developer can make changes and immediately see whether that feature regressed/improved app performance directly on their pull request.
Good luck to all those working on improving startup time and app performance out there and please let us know if you’ve got any questions!