
This is Part 1 of a 2 part series. If you're interested in how to use SwiftUI symbols, read Part 2
Have you ever noticed that crash logs sometimes don't make much sense or are missing some symbols? Unlike traditional UIKit applications, Apple does not provide debug symbols (dSYMs) for SwiftUI. This means that any crash containing SwiftUI addresses in the stack trace will not be symbolicated.
We've discovered a way to symbolicate any Apple framework and want to share it with everyone.
The problem
When you use a crash reporting tool like Sentry, Crashlytics, or Bugsnag, you typically will upload your project's debug symbols (dSYMs) of every release version. These dSYMs enable these tools to symbolicate memory addresses of a crash report into a human-readable format.
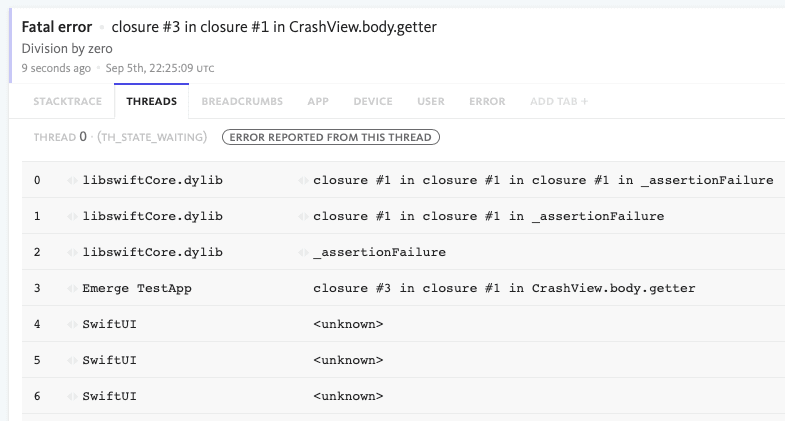
Apple provides symbols for most system frameworks (UIKit, AVFoundation, etc.), but others like SwiftUI, Combine and Metal Performance Shaders Graph are an exception — no symbols are provided. Tools that rely on them handle this by not displaying anything or showing useless information like the memory address. This can make it harder to understand what is going on when reading crashes or Instruments traces.
Why SwiftUI isn't like other frameworks
The reason for this is because the SwiftUI binary in the shipped OS doesn't have symbols names. If we extract it (from the IPSW or iOS DeviceSupport folder: ~/Library/Developer/Xcode/iOS DeviceSupport), we can confirm this scenario.
With the symbols command, we can print binary symbols in the format: address (size) symbol-name [FLAGS]. Here's an example from the Foundation framework:
Foundation [arm64e, 0.016873 seconds]:
  6E76DC96-11AF-3B2E-B71E-215F9CC6E822 Foundation [DYLIB, DYLDSHAREDCACHE, FaultedFromDisk, MMap64]
      0x00000001812e5000 (0x8de000) __TEXT SEGMENT
          0x00000001812e5000 (  0x27d0) MACH_HEADER
          0x00000001812e77d0 (0x5f1684) __TEXT __text
              0x00000001812e77d0 (    0xc8) -[NSComparisonPredicate predicateFormat] [FUNC, OBJC, NameNList, MangledNameNList, Merged, NList, FunctionStarts]
              0x00000001812e7898 (    0x28) -[NSComparisonPredicate comparisonPredicateModifier] [FUNC, OBJC, NameNList, MangledNameNList, Merged, NList, FunctionStarts]
              0x00000001812e78c0 (    0x8c) -[NSCompoundPredicate acceptVisitor:flags:] [FUNC, OBJC, NameNList, MangledNameNList, Merged, NList, FunctionStarts]
              0x00000001812e794c (    0xfc) -[NSCompoundPredicate _acceptSubpredicates:flags:] [FUNC, OBJC, NameNList, MangledNameNList, Merged, NList, FunctionStarts]
              0x00000001812e7a48 (    0xc0) -[NSComparisonPredicate acceptVisitor:flags:] [FUNC, OBJC, NameNList, MangledNameNList, Merged, NList, FunctionStarts]
              0x00000001812e7b08 (    0x60) -[NSComparisonPredicate _acceptExpressions:flags:] [FUNC, OBJC, NameNList, MangledNameNList, Merged, NList, FunctionStarts]
              0x00000001812e7b68 (   0x13c) -[NSFunctionExpression acceptVisitor:flags:] [FUNC, OBJC, NameNList, MangledNameNList, Merged, NList, FunctionStarts]
...But for SwiftUI, most symbols have a null symbol-name:
SwiftUI [arm64e, 0.011490 seconds]:
  E76F182B-D965-3F8C-8D31-7C963B676EEB SwiftUI [DYLIB, DYLDSHAREDCACHE, FaultedFromDisk, MMap64]
      0x000000018a8bf000 (0x1976000) __TEXT SEGMENT
          0x000000018a8bf000 (  0x2a68) MACH_HEADER
          0x000000018a8c1a68 (0x15f41d0) __TEXT __text
              0x000000018a8c1a68 (    0x4c) (null) [FUNC, FunctionStarts]
              0x000000018a8c1ab4 (    0x4c) (null) [FUNC, FunctionStarts]
              0x000000018a8c1b00 (    0x44) (null) [FUNC, FunctionStarts]
              0x000000018a8c1b44 (    0xa8) (null) [FUNC, FunctionStarts]
              0x000000018a8c1bec (    0x44) (null) [FUNC, FunctionStarts]
              0x000000018a8c1c30 (    0x90) (null) [FUNC, FunctionStarts]
              0x000000018a8c1cc0 (    0x84) (null) [FUNC, FunctionStarts]
              0x000000018a8c1d44 (    0x68) (null) [FUNC, FunctionStarts]
...A ray of hope
Apple offers a free crash reporting service inside Xcode Organizer, which collects and symbolicates crash reports for both App Store and TestFlight builds.
These crash reports go through Apple's servers and are symbolicated when possible.
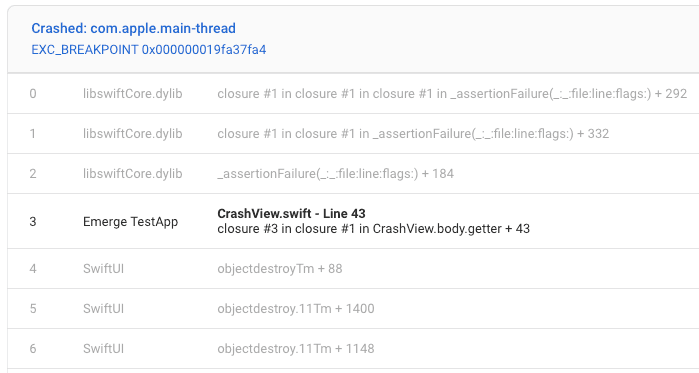
Fortunately for us, SwiftUI is symbolicated in these reports.
This means that Apple does have dSYM files for these frameworks and can process them. The question is, how can we extract them?
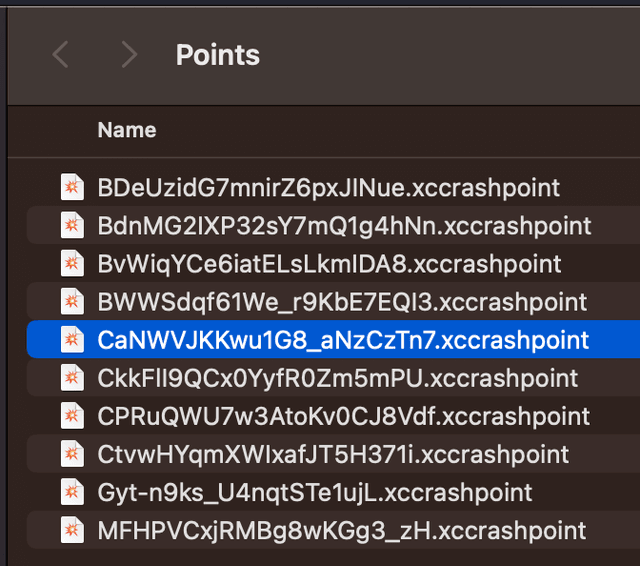
Luckily, Xcode downloads all crash reports and we can find them by right-clicking on them (the saved path is ~/Library/Developer/Xcode/Products/YOUR_APP_BUNDLE_ID/Crashes/Points):
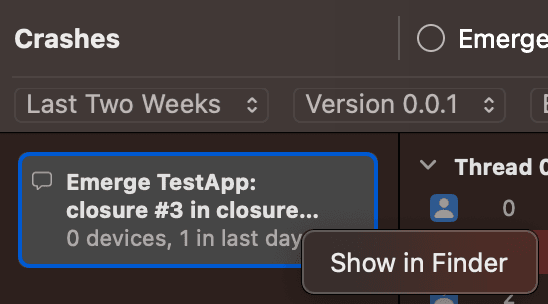
When Finder opens, you will see a lot of "files", with yours selected.
These are actually folders containing crash logs.
You can open them by right-clicking and pressing Show Package Contents.
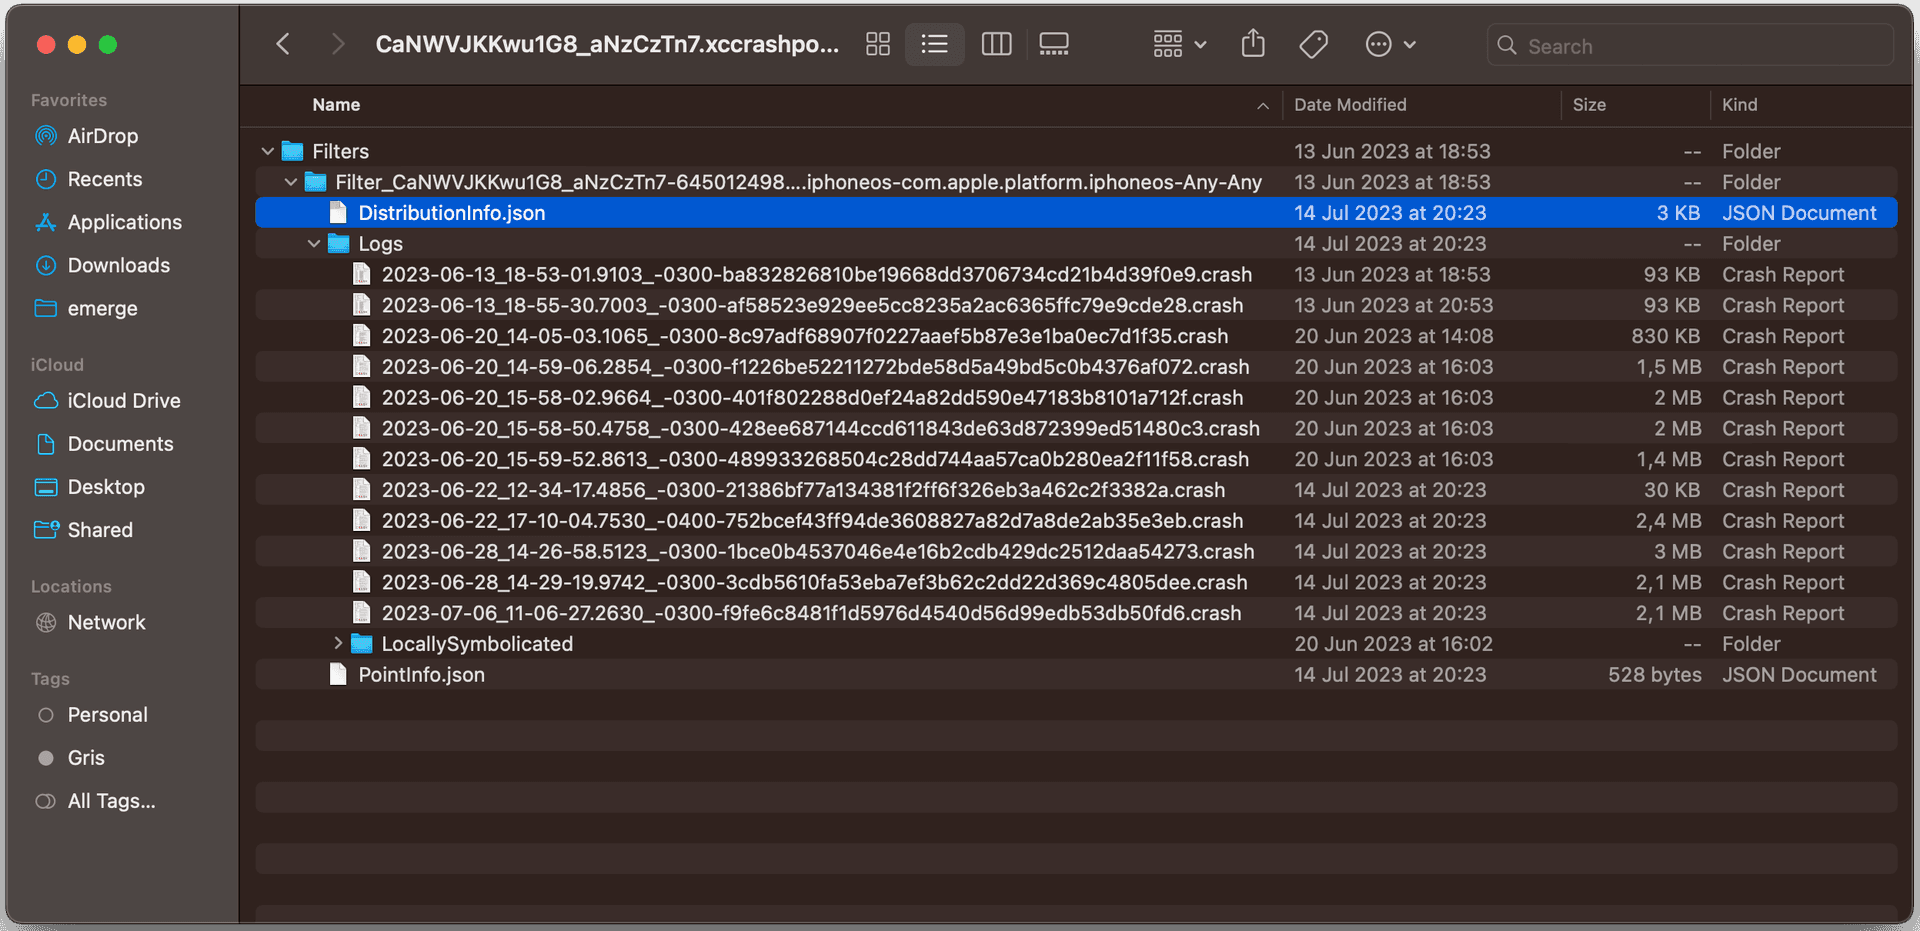
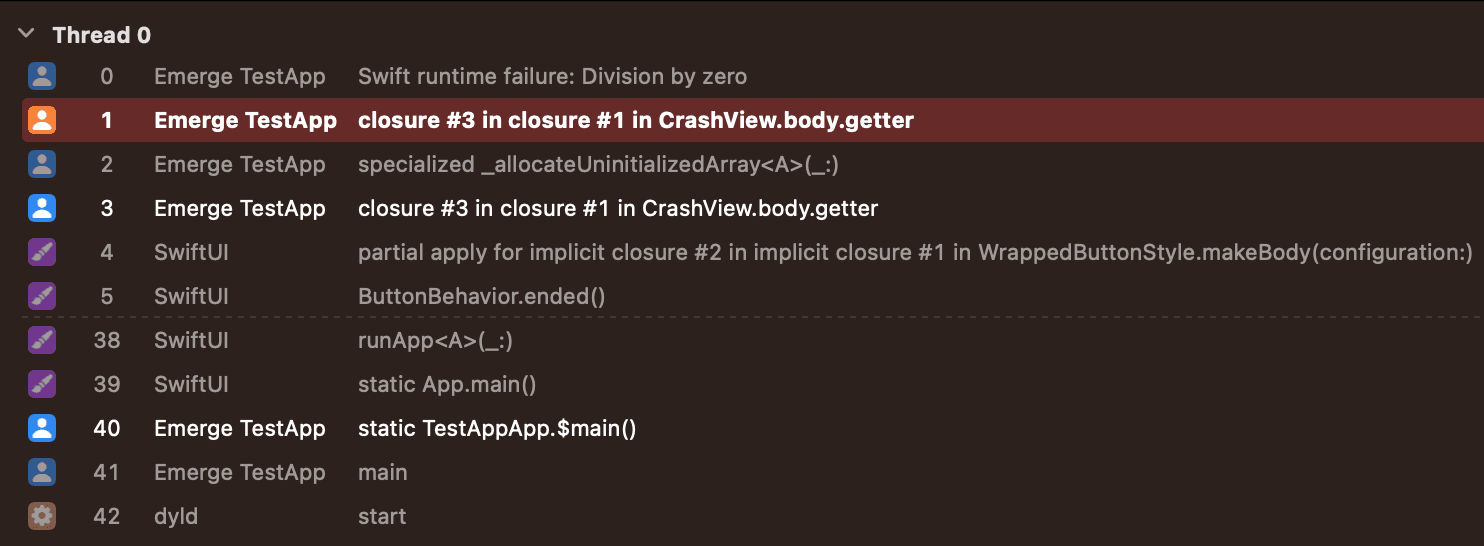
Now we have the symbolicated crash logs. This is a great step, but we need to find a way to do this for a specific memory address.
Incident Identifier: CA429E35-72B9-4412-84D7-40EF2A7718F8
Hardware Model:      iPhone15,2
Process:             Emerge TestApp [22028]
...
Exception Type:  EXC_BREAKPOINT (SIGTRAP)
Exception Codes: 0x0000000000000001, 0x0000000100da8710
...

Thread 0 name:
Thread 0 Crashed:
0 Emerge TestApp 0x0000000100da8710 Swift runtime failure: Division by zero + 0 (<compiler-generated>:0)
1 Emerge TestApp 0x0000000100da8710 closure #3 in closure #1 in CrashView.body.getter + 432 (CrashView.swift:43)
2 Emerge TestApp 0x0000000100da8600 specialized _allocateUninitializedArray<A>(_:) + 24 (<compiler-generated>:0)
3 Emerge TestApp 0x0000000100da8600 closure #3 in closure #1 in CrashView.body.getter + 160 (CrashView.swift:43)
4 SwiftUI 0x00000001a9e9ad98 partial apply for implicit closure #2 in implicit closure #1 in WrappedButtonStyle.makeBody(configuration:) + 28
5 SwiftUI 0x00000001a9e9b320 ButtonBehavior.ended() + 240 (ButtonStyle.swift:349)
6 SwiftUI 0x00000001a9e9b224 implicit closure #2 in implicit closure #1 in ButtonBehavior.body.getter + 32 (ButtonStyle.swift:301)
...

...
Binary Images:
0x100da0000 - 0x100dabfff Emerge TestApp arm64 <5761b557a08d3b79ba5015baac99164b> /private/var/containers/Bundle/Application/5DBAE586-D41D-486F-9E31-03F97FFDA005/Emerge TestApp.app/Emerge TestAppTestApp.app/Emerge TestApp
...
0x1a956f000 - 0x1aaee7fff SwiftUI arm64e <14c7908e8c603bf7b6d8937d502b5918> /System/Library/Frameworks/SwiftUI.framework/SwiftUI
...This blog focuses on symbolicating SwiftUI, but the techniques described work with other frameworks.
Finding symbols for an address
The above method works, but making the app crash for every symbol is not feasible (there are more than 198725 symbols in SwiftUI). We need to find a way to manipulate the memory to add addresses in bulk.
The first step is to get the current stack trace. Initially we tried Swift's Thread.callStackSymbols, but this returns an array of already symbolicated symbols. Good for debugging, but not what we're looking for.
We then looked at Libc's backtrace. This alternative returns the addresses, and more importantly, is open source so we can examine how it works.
Looking at the implementation of backtrace:
int backtrace(void** buffer, int size) {
unsigned int num_frames;
_thread_stack_pcs((vm_address_t*)buffer, size, &num_frames, 1, NULL);
while (num_frames >= 1 && buffer[num_frames-1] == NULL) num_frames -= 1;
return num_frames;
}
The relevant part of the code is in _thread_stack_pcs , implemented here:
void _thread_stack_pcs(vm_address_t *buffer, unsigned max, unsigned *nb, unsigned skip) {
  void *frame, *next;
  pthread_t self = pthread_self();
  void *stacktop = pthread_get_stackaddr_np(self);
  void *stackbot = stacktop - pthread_get_stacksize_np(self);

  *nb = 0;
  stacktop -= (FP_LINK_OFFSET + 1) * sizeof(void *);

  frame = __builtin_frame_address(0);

  if (!INSTACK(frame) || !ISALIGNED(frame)) {
      return;
  }

  // Stripped skip code

  while (max--) {
      buffer[*nb] = *(vm_address_t *)(((void **)frame) + FP_LINK_OFFSET);
      (*nb)++;
      next = *(void **)frame;

      if (!INSTACK(next) || !ISALIGNED(next) || next <= frame) {
          return;
      }

      frame = next;
  }

};
Let’s break this code down, first it gets the current thread and obtains the top and bottom of the stack, plus align the bottom of the stack with the memory (FP_LINK_OFFSET is the size of the memory pointer):
pthread_t self = pthread_self();
void *stacktop = pthread_get_stackaddr_np(self);
void *stackbot = stacktop - pthread_get_stacksize_np(self);

stacktop -= (FP*LINK_OFFSET + 1) * sizeof(void _);
This information will be essential to parsing the stacktrace.
Then it gets the current frame address and checks it is in the stack and it is memory aligned, otherwise, it exits.
frame = __builtin_frame_address(0);
if(!INSTACK(frame) || !ISALIGNED(frame))
return;
With that, it can easily iterate the addresses in the stack:
while (max--) {
buffer[*nb] = *(vm_address_t *)(((void **)frame) + FP_LINK_OFFSET);
(*nb)++;
next = *(void **)frame;
if(!INSTACK(next) || !ISALIGNED(next) || next <= frame)
  return;
frame = next;
}
This low-level code works well, but we can make it a little more readable if we consider the structure that is used for the stack:
typedef uintptr_t frame_data_addr_t;

struct frame_data {
  frame_data_addr_t frame_addr_next;
  frame_data_addr_t ret_addr;
};
Given this information, we can build our own print_my_backtrace implementation:
void print_my_backtrace() {
  int max = 100; // Print up to 100 frames
  void *frame, *next;
  pthread_t self = pthread_self();
  void *stacktop = pthread_get_stackaddr_np(self);
  void *stackbot = stacktop - pthread_get_stacksize_np(self);

  frame = __builtin_frame_address(0);

  if (!INSTACK(frame) || !ISALIGNED(frame)) {
      return;
  }

  int counter = 0;
  while (max--) {
      struct frame_data *currentFrame = (struct frame_data *)frame;
      printf("[%i] - %lu", counter, currentFrame->ret_addr);

      next = (void *)currentFrame->ret_addr;

      if (!INSTACK(next) || !ISALIGNED(next) || next <= frame) {
          return;
      }

      frame = next;
  }

};
Here the stacktrace prints the frame for print_my_backtrace. We need to adjust the frame to the next one before starting the counter to skip it. frame_data is modifiable, meaning we can actually replace the return address (ret_addr) with any address we want. Given the current implementation, we can do this for every thread and replace every function in the stack.
Now that we can edit the stack, we need to get the address of all symbols in the symbols output for SwiftUI. This next section will cover how to analyze the SwiftUI binary in memory to find all functions.
Getting all addresses for SwiftUI
While this step sounds hard, it's actually one of the easiest. There is open source code we can use to extract the Function Starts, which gives the starting address of each function in a Mach-O binary.
First, we can use dyld to get a load address for SwiftUI:
const imagePath = "/System/Library/Frameworks/SwiftUI.framework/SwiftUI"
const uint32_t image_count = _dyld_image_count();
for (uint32_t image_index = 0; image_index < image_count; image_index++) {
  const char *imageName = _dyld_get_image_name(image_index);

  if (strcmp(imageName, imagePath) != 0) {
      continue;
  }

  const struct mach_header_64 *header = (const void *)_dyld_get_image_header(image_index);
  ...
}
With the image header found, we just need to iterate over the load commands until we find the information we need. LC_SEGEMENT_64 gives us information for finding and verifying Function Starts data. The LC_FUNCTION_STARTS load command gets all the function starts.
#import <mach-o/dyld.h>

intptr_t slide = _dyld_get_image_vmaddr_slide(image_index);

uint64_t linkedit_seg_start = 0;
uint64_t linkedit_seg_end = 0;
uint64_t linkedit_seg_fileoff = 0;

uint64_t text_seg_start = 0;
uint64_t text_sect_start = 0;
uint64_t text_sect_end = 0;

const struct load*command _load_cmd = (const void *)(header + 1);
for (uint32*t i = 0; i < header->ncmds; ++i) {
switch (load_cmd->cmd) {
case LC_SEGMENT_64: {
const struct segment_command_64 _seg_cmd = (const void *)load_cmd;

          // The __LINKEDIT info is needed to compute the address of the Function Starts data
          if (strncmp(seg_cmd->segname, SEG_LINKEDIT, sizeof(seg_cmd->segname)) == 0) {
              linkedit_seg_fileoff = seg_cmd->fileoff;
              linkedit_seg_start = seg_cmd->vmaddr + slide;
              linkedit_seg_end = linkedit_seg_start + seg_cmd->vmsize;
          }

          if (strncmp(seg_cmd->segname, SEG_TEXT, sizeof(seg_cmd->segname)) == 0) {
              text_seg_start = seg_cmd->vmaddr + slide;
              // Get the __text section info so that we can verify the function addresses parsed later
              for (uint32_t sect_idx = 0; sect_idx < seg_cmd->nsects; sect_idx++) {
                  const struct section_64 *section = (const struct section_64 *)(seg_cmd + 1) + sect_idx;
                  if (strncmp(section->sectname, SECT_TEXT, sizeof(section->sectname)) == 0) {
                      text_sect_start = section->addr + slide;
                      text_sect_end = text_sect_start + section->size;
                      break;
                  }
              }
          }

          break;
      }
      case LC_FUNCTION_STARTS: {
        ...
      }
  }
  // Read next load command
  load_cmd = (const void *)((const char *)load_cmd) + load_cmd->cmdsize;

}
To parse the Function Starts we can use Apple’s implementation here, adapting to our interests:
uint64_t* functionStartsArray = malloc(sizeof(uint64_t) * INITIAL_CAPACITY);
int capacity = INITIAL_CAPACITY;
int counter = 0;

...
case LC*FUNCTION_STARTS: {
const struct linkedit_data_command _data_cmd = (const void *)load*cmd;
assert(data_cmd->dataoff > linkedit_seg_fileoff);
const uint32_t offset_from_linkedit = data_cmd->dataoff - (uint32_t) linkedit_seg_fileoff;
const uint8_t _start = (const uint8_t *)linkedit_seg_start + offset_from_linkedit;
const uint8_t *end = start + data_cmd->datasize;
assert((uintptr_t)end < linkedit_seg_end);

  uint64_t address = text_seg_start;

  // Function starts are stored as a series of offsets encoded as LEB128.
  // Adapted from DyldInfoPrinter<A>::printFunctionStartsInfo() in ld64-127.2/src/other/dyldinfo.cpp
  for (const uint8_t *p = start; (*p != 0) && (p < end); ) {

      // Increase array capacity
      if (counter == capacity) {
          capacity *= 2;
          functionStartsArray = realloc(functionStartsArray, sizeof(uint64_t) * capacity);

          if (functionStartsArray == NULL) {
              fprintf(stderr, "Memory reallocation failed");
              exit(1);
          }
      }

      uint64_t delta = 0;
      uint32_t shift = 0;
      bool more = true;
      do {
          uint8_t byte = *p++;
          delta |= ((byte & 0x7F) << shift);
          shift += 7;
          if (byte < 0x80) {
              address += delta;
              assert(// Function address resides in the __text section
                     address >= text_sect_start && address < text_sect_end);

              functionStartsArray[counter++] = address;

              more = false;
          }
      } while (more);
  }
  break;

}
Since we want to get the complete list of function starts, we are saving the addresses in an array. To make it easier, I'm using a plain array of pointers in C and doubling size when necessary.
Improving symbols extraction
Now we have all the information we need to rebuild the symbols. By inserting the addresses extracted from LC_FUNCTION_STARTS into our modified stacktrace, we can fake a crash with SwiftUI functions to symbolicate them.
While I haven't found documentation for the maximum stack size or limit of threads for iOS, I haven't been able to get more than 550 frames from Apple's crashes. So we would need 198725/550=361 crashes to fully symbolicate — not viable to do.
Fortunately, Apple symbolicates all threads, so we can actually create multiple threads before crashing. I created EMGThread to help:
#define    MAX_FRAMES 550

@interface EMGThread : NSThread
@property (copy) void (^completionBlock)(void);
@property (nonatomic, assign) NSInteger startingIndex;
@property (nonatomic, assign) uint64_t *addresses;
@end#define INSTACK(a) ((a) >= stackbot && (a) <= stacktop)
#define ISALIGNED(a) ((((uintptr_t)(a)) & 0x1) == 0)
typedef uintptr_t frame_data_addr_t;
struct frame_data {
frame_data_addr_t frame_addr_next;
frame_data_addr_t ret_addr;
};
@interface EMGThread ()
@property (nonatomic, assign) NSInteger threadLoopCounter;
@end
@implementation EMGThread
-(void) main {
if (_threadLoopCounter < MAX_FRAMES) {
_threadLoopCounter++;
[self main];
}
[self modifyFrameAndWait];
}
- (void) modifyFrameAndWait {
// Number of frames to print
int max = MAX_FRAMES;
void *frame, *next;
pthread_t thisThread = pthread_self();
void *stacktop = pthread_get_stackaddr_np(thisThread);
void *stackbot = stacktop - pthread_get_stacksize_np(thisThread);
// Rely on the fact that our caller has an empty stackframe (no local vars)
// to determine the minimum size of a stackframe (frame ptr & return addr)
frame = __builtin_frame_address(0);
next = (void *)((struct frame_data *) frame)->ret_addr;
/* make sure return address is never out of bounds */
stacktop -= (next - frame);
int counter = 0;
if(!INSTACK(frame) || !ISALIGNED(frame))
return;
// Skip one frame so we can return to the calling function if needed
frame = next;
while (max--) {
// Attempt to overwrite
struct frame_data *frameModifier = (struct frame_data *)frame;
// Add +2 so address is AFTER the function start
frameModifier->ret_addr = self.addresses[self.startingIndex + counter++] + 2;
next = (void *)frameModifier->ret_addr;
if(!INSTACK(next) || !ISALIGNED(next) || next <= frame)
return;
frame = next;
}
// Notify of completion
self.completionBlock();
// Sleep this thread but keep it alive for the stacktrace
while(true) {
[NSThread sleepForTimeInterval:0.01];
}
}We will also use a helper class EMGCrasher to sync the multiple threads and crash the app when everything is ready.
class EMGCrasher {
  var completedThreads = 0
  let lock = NSLock()

  func crash(_ threadCount: Int) -> Bool {
      let functions = get_function_starts()
      let threadCount = functions.functionsCount / Int(MAX_FRAMES)

      for index in 0..<threadCount {
          let thread = EMGThread()
          thread.startingIndex = index * Int(MAX_FRAMES)
          thread.addresses = functions.functionsPointers!
          thread.completionBlock = { [self] in
              self.lock.lock()
              self.completedThreads += 1
              self.lock.unlock()
          }
          thread.start()
      }

      while(completedThreads != threadCount) {
          usleep(100)
      }

      fatalError("Crash App (Excpected)")
  }
}
Wrapping Up
With these steps, we now have the complete SwiftUI framework symbolicated. We'll be releasing a second part of this blog where we go through parsing the crashes and building a tool to help symbolicate them.
You can subscribe to our newsletter below to get notified when it comes out! Until then, happy coding and happy symbolication!